The following apps have been tested and have been approved by IT Libertas developers, in order to help you use Odoo. When programmers had faced any bugs, they fixed them. The resulted modules are structured and would be used as a base of Odoo implementation. Besides, each description contains links to download an application and to configure it with your own hands
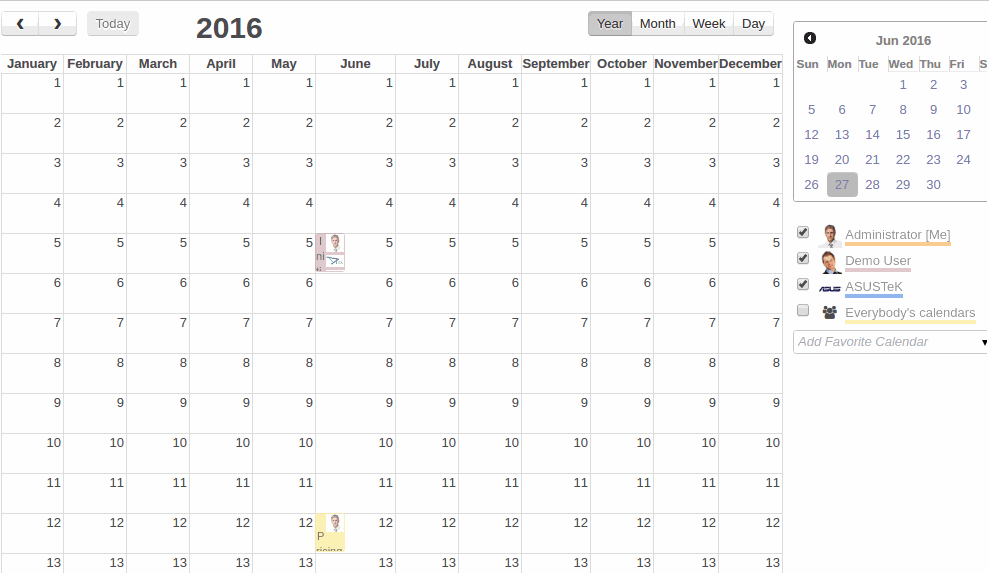
Observe the whole year on a calendar view
In addition to monthly, weekly and daily views, this app defines a yearly view to each Odoo calendar. Install it, and observe events, tasks, orders of the whole year. It is quite useful to the needs of long-run planning.
This module does not require any configuration and works for Odoo 8. Download it here.
Timelines of any Odoo objects
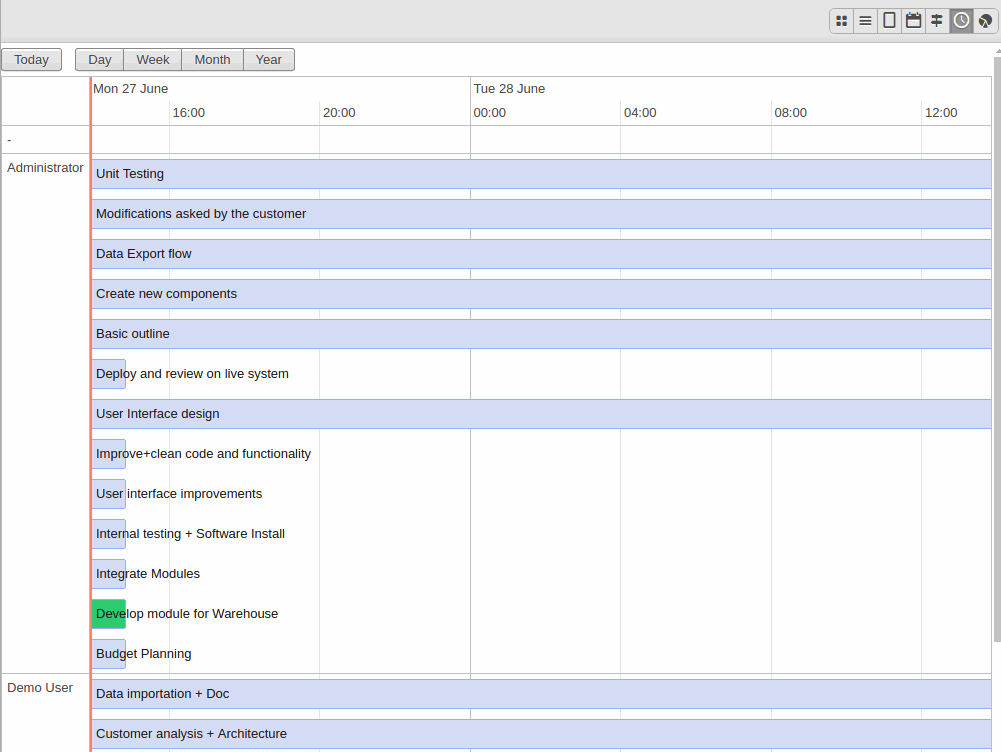
The Odoo app web_timeline is for those, who are not satisfied with general Gantt or Kanban views (for Odoo 8 only). It let users observe the whole picture from chronological point of view. You may:
- Scale up and down
- Group by any indicator (through Odoo search tools)
- Scroll horizontally and vertically
<record id="record_id" model="ir.ui.view">
<field name="name">Any Name</field>
<field name="model">odoo.model</field>
<field name="type">timeline</field>
<field name="arch" type="xml">
<timeline date_start="date_start" date_stop="date_stop" date_delay='date_delay' string="Label" default_group_by="default_group_by" event_open_popup="true" colors="hex_color:condition;">
</timeline>
</field>
</record>
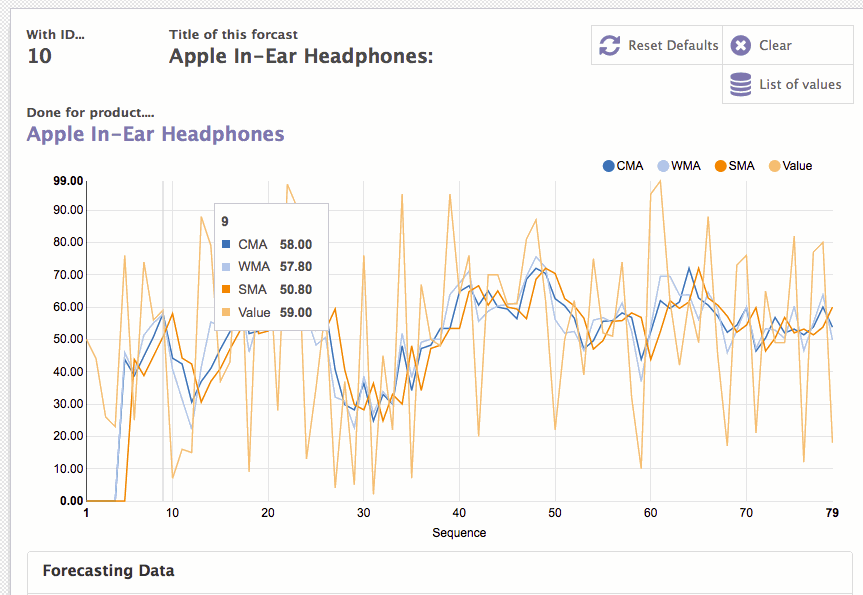
Make proficient graphs based on numerical data
One of the issues, which usually bother Odoo users, is data visualization. The app under consideration solves this task partially by adding an ability to display a line graph. Sure, the data must be numerical in a form of a one2many or a many2many table.
The usage of this view is fairly simple. We need to provide fields names and (optionally) colors for each field. Thus, a horizontal axis represents objects, while a vertical axis shows values range according to given parameters. Example is:
<graph >
<field name="sequence"/>
<field name="value"/>
<field name="sma"/>
<field name="cma"/>
<field name="wma"/>
</graph>
</field>
The module is tested on Odoo 8. Download it here.